I spent three months trying to build the “perfect” portfolio. Then I backtested the simplest one — three funds, rebalanced once a year — and realized I’d been wasting my time.
The Portfolio
- 60% US Total Stock Market (VTI or equivalent)
- 30% International Stock Market (VXUS or equivalent)
- 10% US Total Bond Market (BND or equivalent)
Rebalanced to target allocation once per year on January 1st. That’s the entire strategy.
30-Year Backtest Results (1995-2025)
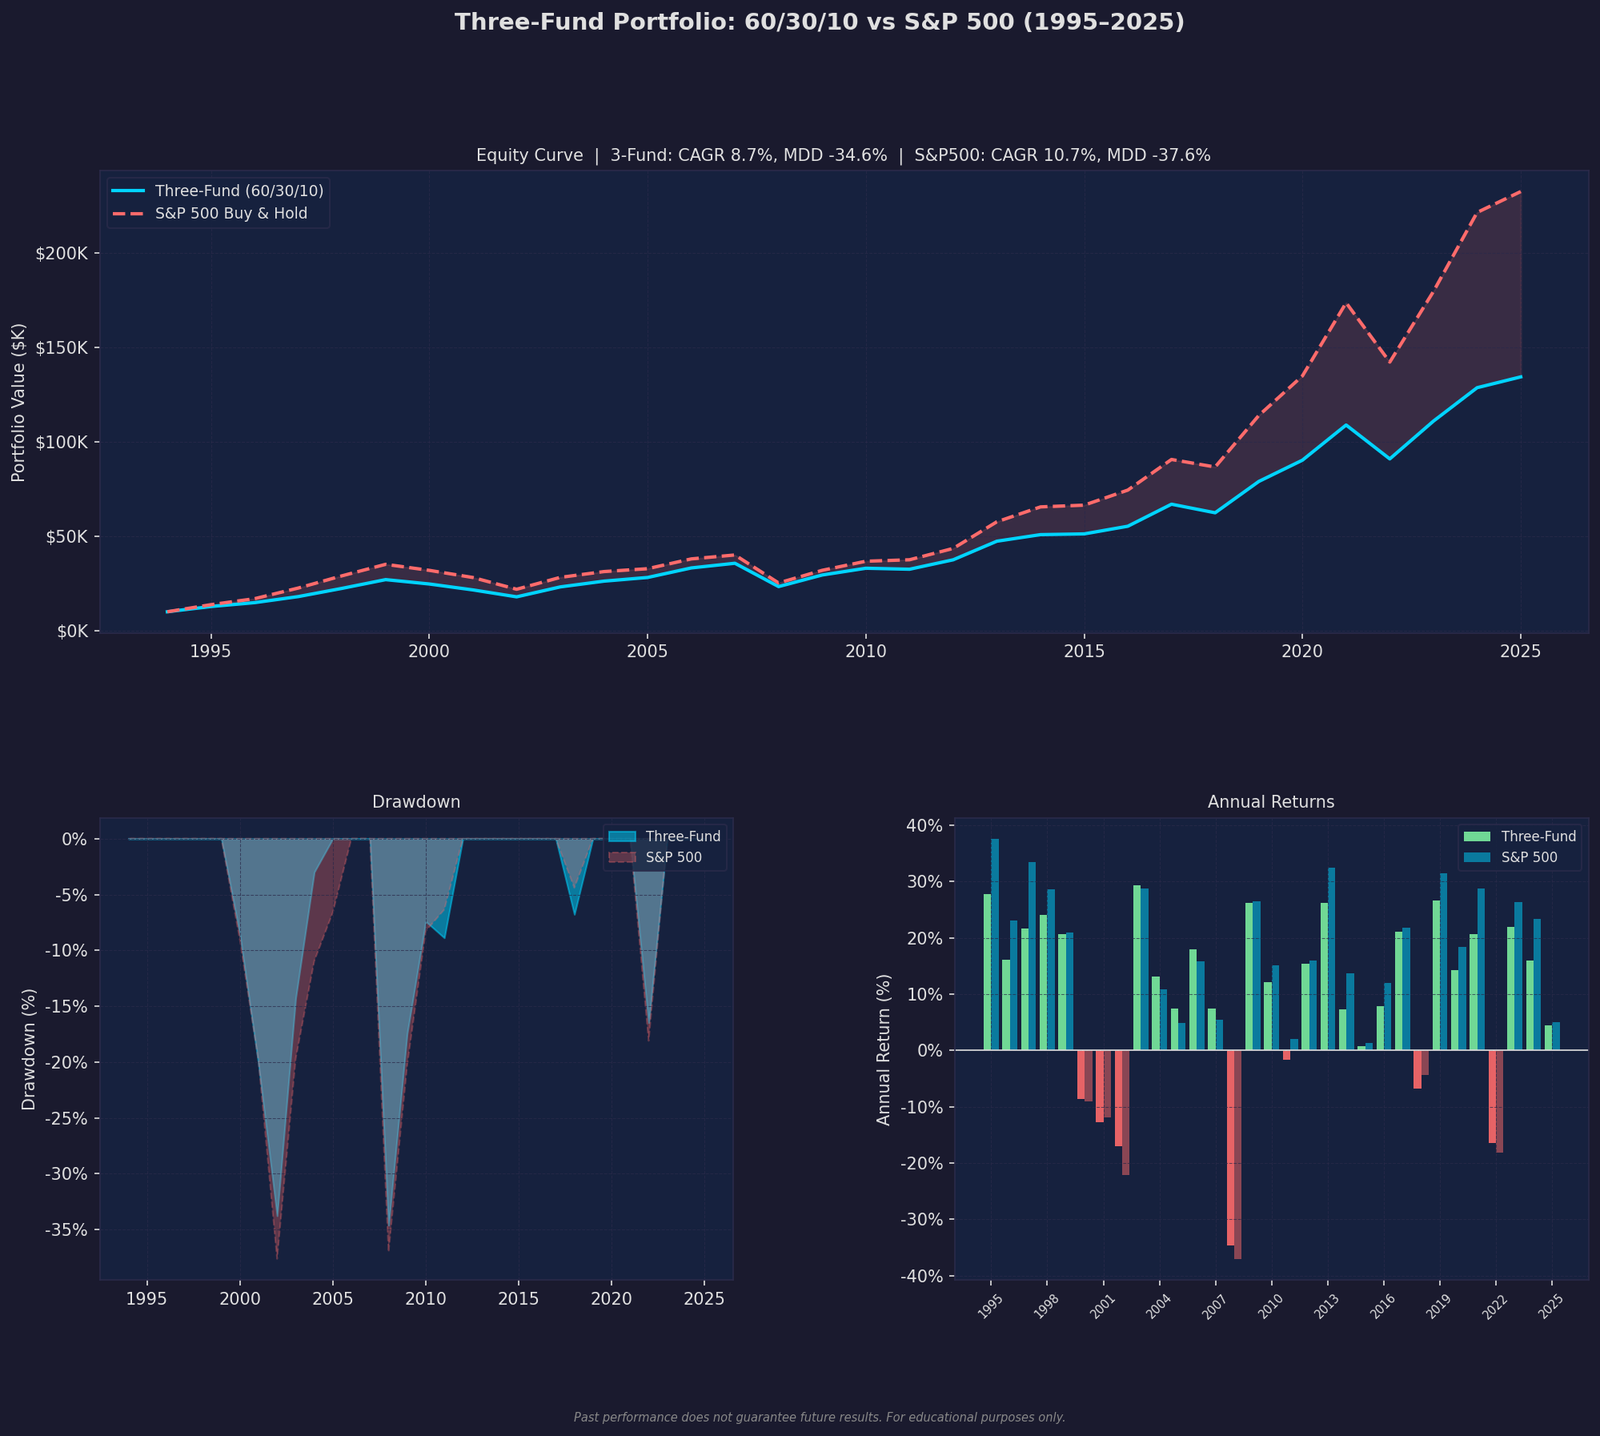
| Metric | Three-Fund | S&P 500 Only |
|---|---|---|
| CAGR | 8.74% | 10.68% |
| Max Drawdown | -34.6% | -37.6% |
| Sharpe Ratio | 0.45 | 0.52 |
| Sortino Ratio | 0.63 | 0.71 |
| $10K → Final Value | $134,449 | $232,662 |
Wait — S&P 500 Beats It?
Yes, on raw returns. So why not just hold the S&P 500?
Because you don’t know that in advance. From 2000-2010, the S&P 500 returned essentially 0% (the “lost decade”). International stocks and bonds both outperformed during that period [1]. The three-fund portfolio survived that decade with positive returns because diversification protected it.
Backtesting the S&P 500 alone is survivorship bias — you’re selecting the winner after the race. In 1995, you couldn’t have known US stocks would dominate the next 30 years.
The Drawdown Story
Look at the drawdown chart. During 2008-2009:
- S&P 500: -37.6% peak-to-trough
- Three-Fund: -34.6% peak-to-trough
That 3% difference doesn’t sound like much. But psychologically, it’s enormous. At -37%, many investors capitulate. At -34%, more hold on. The portfolio you can stick with beats the portfolio you abandon during a crash.
Why Annual Rebalancing Is Free Alpha
When you rebalance, you’re forced to sell what went up (expensive) and buy what went down (cheap). This is systematic buy-low, sell-high — the opposite of what emotional investors do [2].
Over 30 years, this mechanical discipline compounds quietly.
The Real Advantage
The three-fund portfolio’s greatest strength isn’t performance. It’s time. Setup takes 30 minutes. Annual maintenance takes 15 minutes. Total time invested over 30 years: roughly 8 hours.
Compare that to active investors spending 5+ hours per week researching, trading, and worrying. That’s 7,800+ hours over 30 years — to likely underperform three index funds [3].
References
[1] Bernstein WJ. The Four Pillars of Investing. McGraw-Hill, 2010.
[2] Bogle JC. The Little Book of Common Sense Investing. Wiley, 2017.
[3] S&P SPIVA Scorecard. “Over 15-year periods, 92% of actively managed funds underperform their benchmark.” spglobal.com/spiva
Disclaimer: Educational content based on historical backtesting using Yahoo Finance data. Not financial advice. Past performance does not guarantee future results.